Sync History & Errors
Diagnose product-sync issues, replay batches, and find the root cause when something goes wrong.
When Something Goes Wrong, You Have Receipts
The Product Sync page in your dashboard logs every batch sync, every WP-CRON fire, every manual sync, and every error. The Errors page collects everything that's broken across the whole system. Both have detailed enough info that you can self-diagnose 90% of issues.
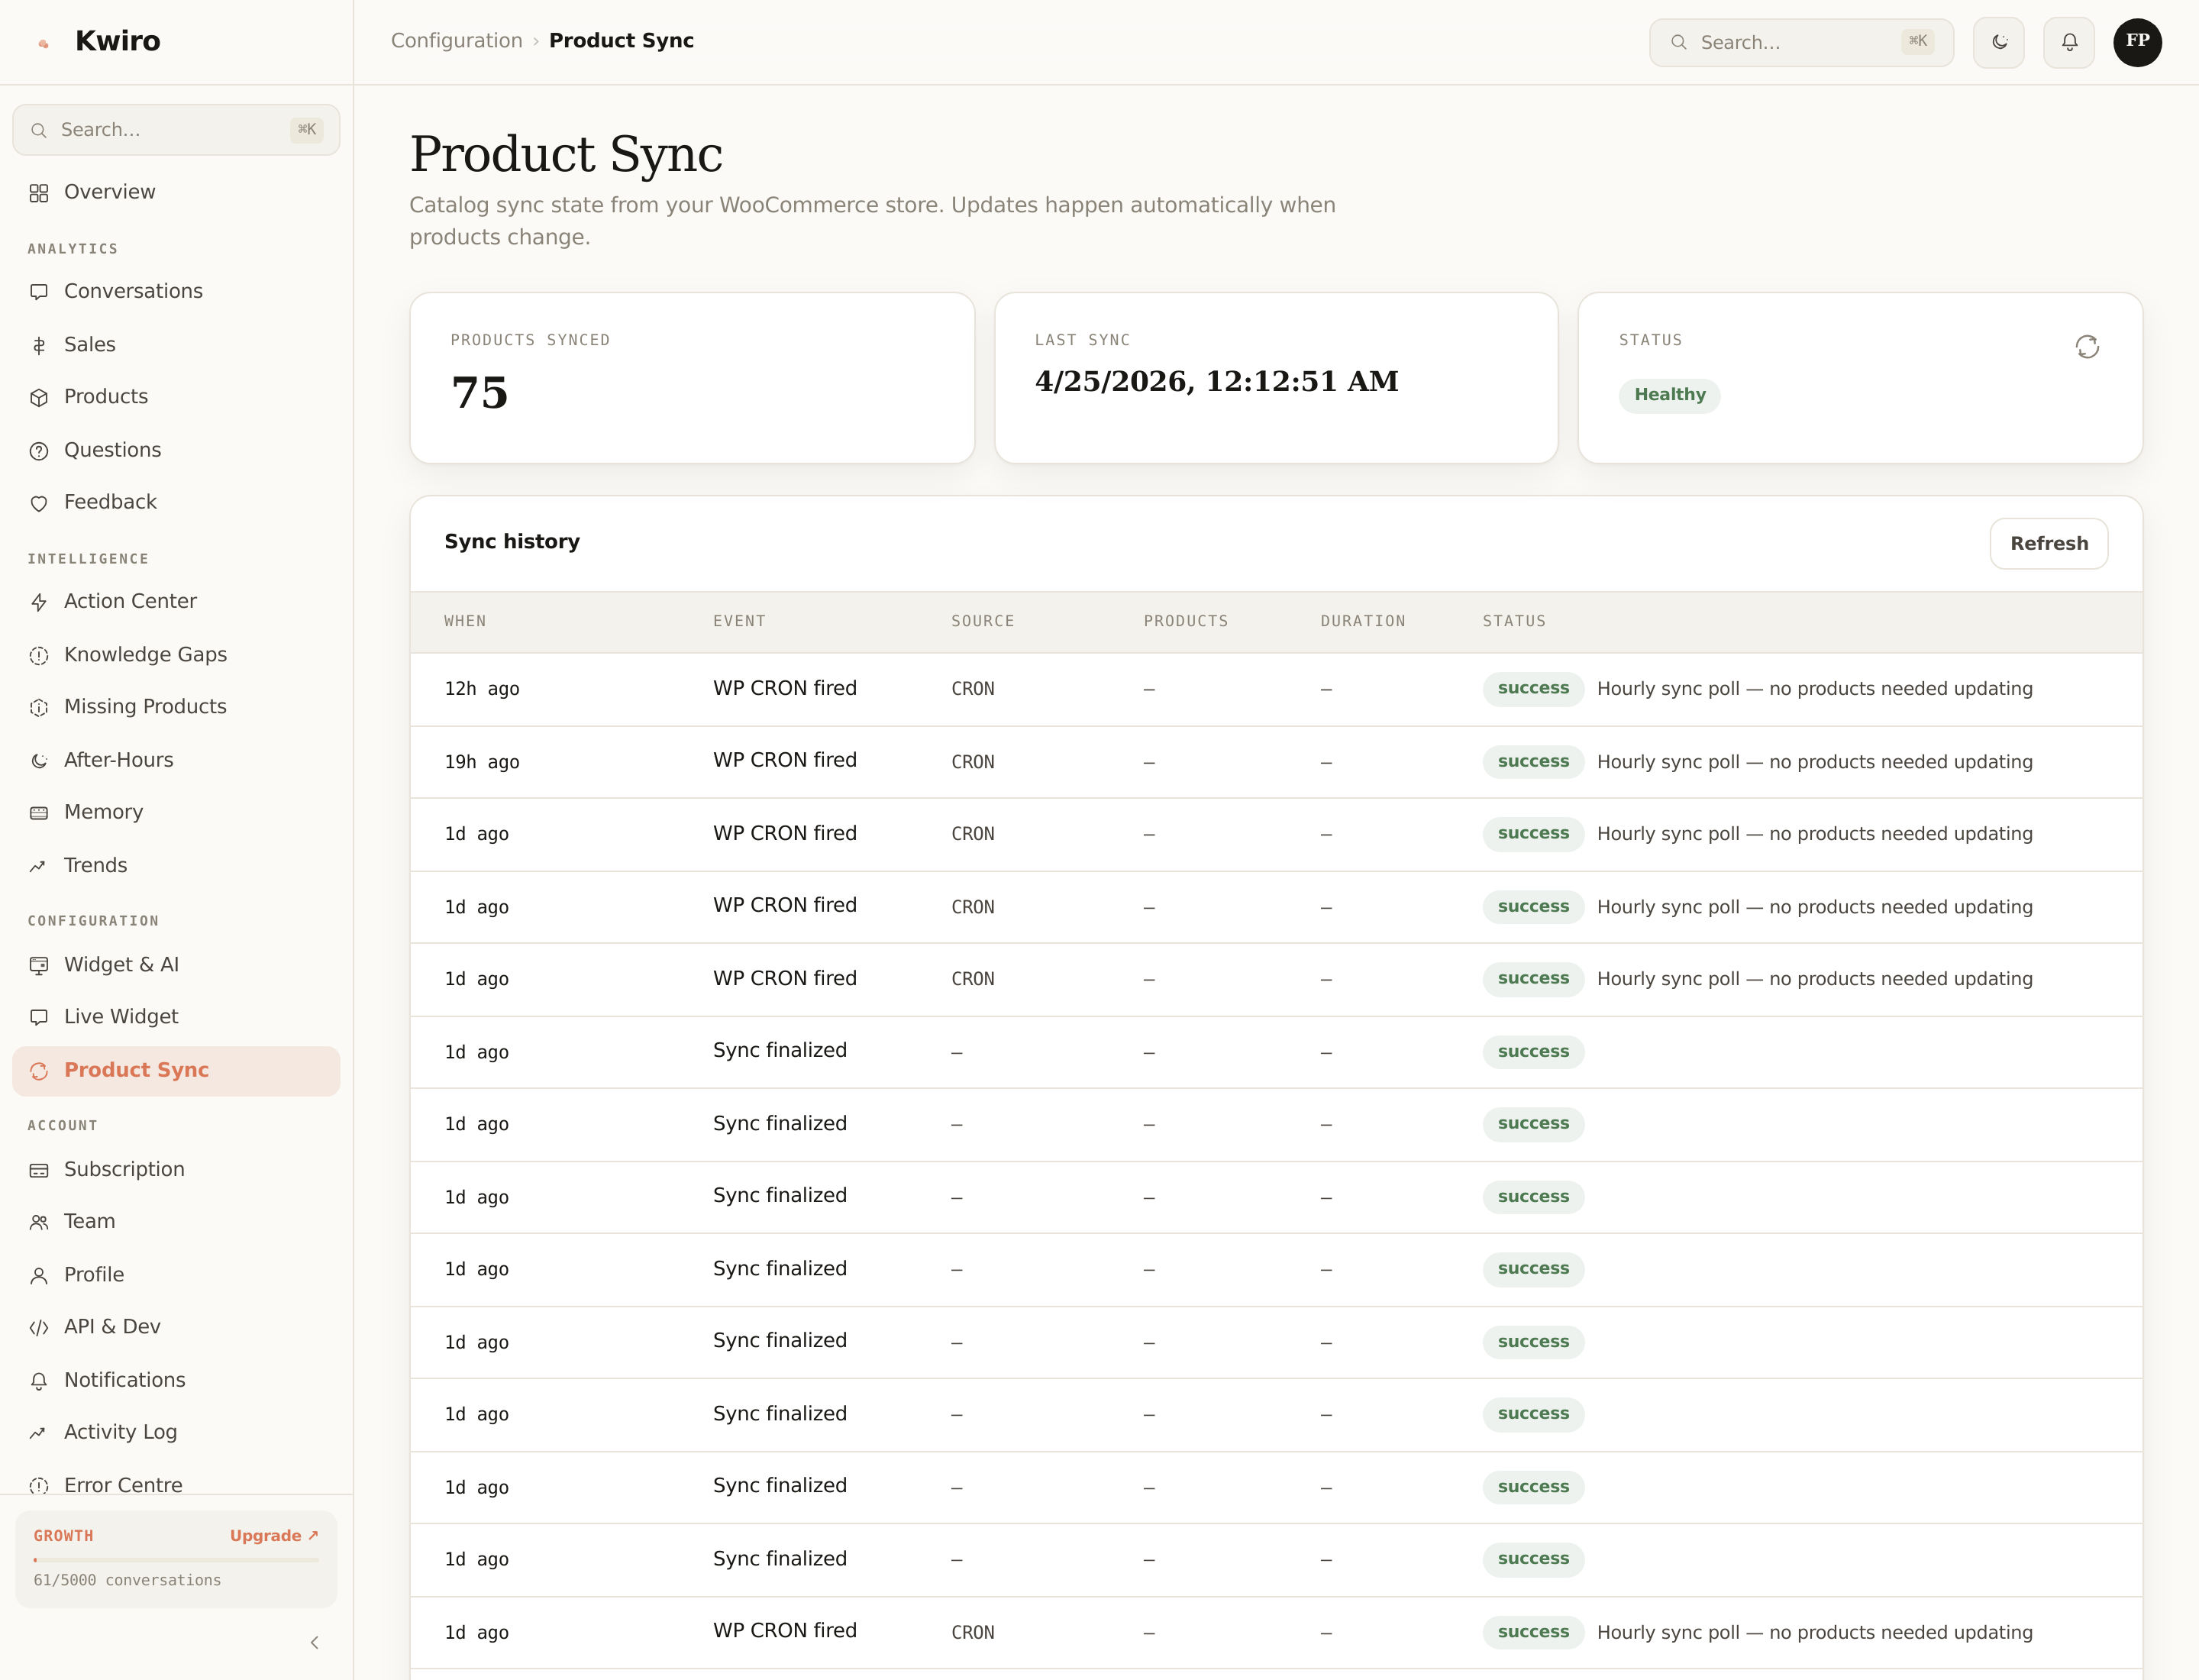
Sync History (Product Sync page)
Each row shows:
| Column | What |
|---|---|
| When | Relative timestamp ("3m ago", "2h ago"). |
| Event | Batch synced / WP CRON fired / Manual sync / Plugin activated / Sync finalized / Error. |
| Source | Manual / CRON / WC hook / Activation. |
| Products | Number of products processed in this event. |
| Duration | Wall-clock time in ms (helps spot slow hosts). |
| Status | Success / partial / error. |
Successful runs are green pills; partial / error rows are yellow / red, with the error message inline so you can scan for patterns.
Reading sync timing
- Under 2 sec / batch — your host is fast, no concerns.
- 2-10 sec / batch — typical shared hosting, plugin auto-tunes batch size, fine.
- >10 sec / batch — your host is slow. Plugin already shrinks batches on this signal, but you may want to consider better hosting if it persists.
Errors page
Pulls from two sources merged into one timeline:
- API errors (cloud-side) — anything our cloud rejected, returned 5xx for, or recorded as a defect. Categorised by kind:
validation,auth,rate_limit,ai_error,db_error,paddle_error, etc. - Sync errors (plugin-side) — batch failures from the WordPress side that made it to us via the sync events table.
Each row has:
- Timestamp
- Severity (info / warn / error)
- Kind
- Message — the actual error
- Context — additional fields (conversation ID, batch number, etc.)
- "Mark resolved" button so you can clear handled errors out of the unresolved view
Toggle Include resolved to see history; default view is unresolved-only.
Common Errors
| Message | What it means | Fix |
|---|---|---|
Sync timed out (45s) | A batch took too long for the API to wait | Plugin auto-shrinks the next batch. If persistent, consider a faster host. |
Plan limit reached | New conversations being soft-degraded or hard-blocked | Upgrade or set strict mode. See Conversation Limits. |
Paddle webhook rejected (signature mismatch) | A webhook from Paddle didn't verify | If you see this once, ignore (Paddle retries). If persistent, contact [email protected]. |
Embedding generation failed | One specific product couldn't be embedded | Usually a malformed description. The product is skipped; the rest of the catalog is fine. |
Rate limit hit | Burst from one IP exceeded per-minute caps | Self-resolves; the 30 min idle timeout flushes the offending session. |
Pagination
Both pages use cursor-based pagination ("Load older events" button). Old events stay queryable for 90 days.
When to Email Support
If an error keeps repeating after 24h or you can't decipher it, email [email protected] with:
- The error ID (visible on the error row)
- Your store domain
- What you were doing when it happened
We respond within 24h on Pro, 4h on Growth, 1h on Scale.
Related reading
Getting Started
What is Kwiro?
Learn what Kwiro does, who it's for, and how it turns your WooCommerce store into a 24/7 sales machine.
ReadDaily Use
Your Dashboard Overview
A guided tour of the Kwiro dashboard -- see your AI's performance, revenue impact, and customer conversations at a glance.
ReadCustomization
Customizing Your Widget
Match the Kwiro chat widget to your store's brand with custom colors, position, welcome message, and bot name.
Read